Attribution report
To view your Attribution report:
-
Go to Marketing in the left pane and select Attribution.
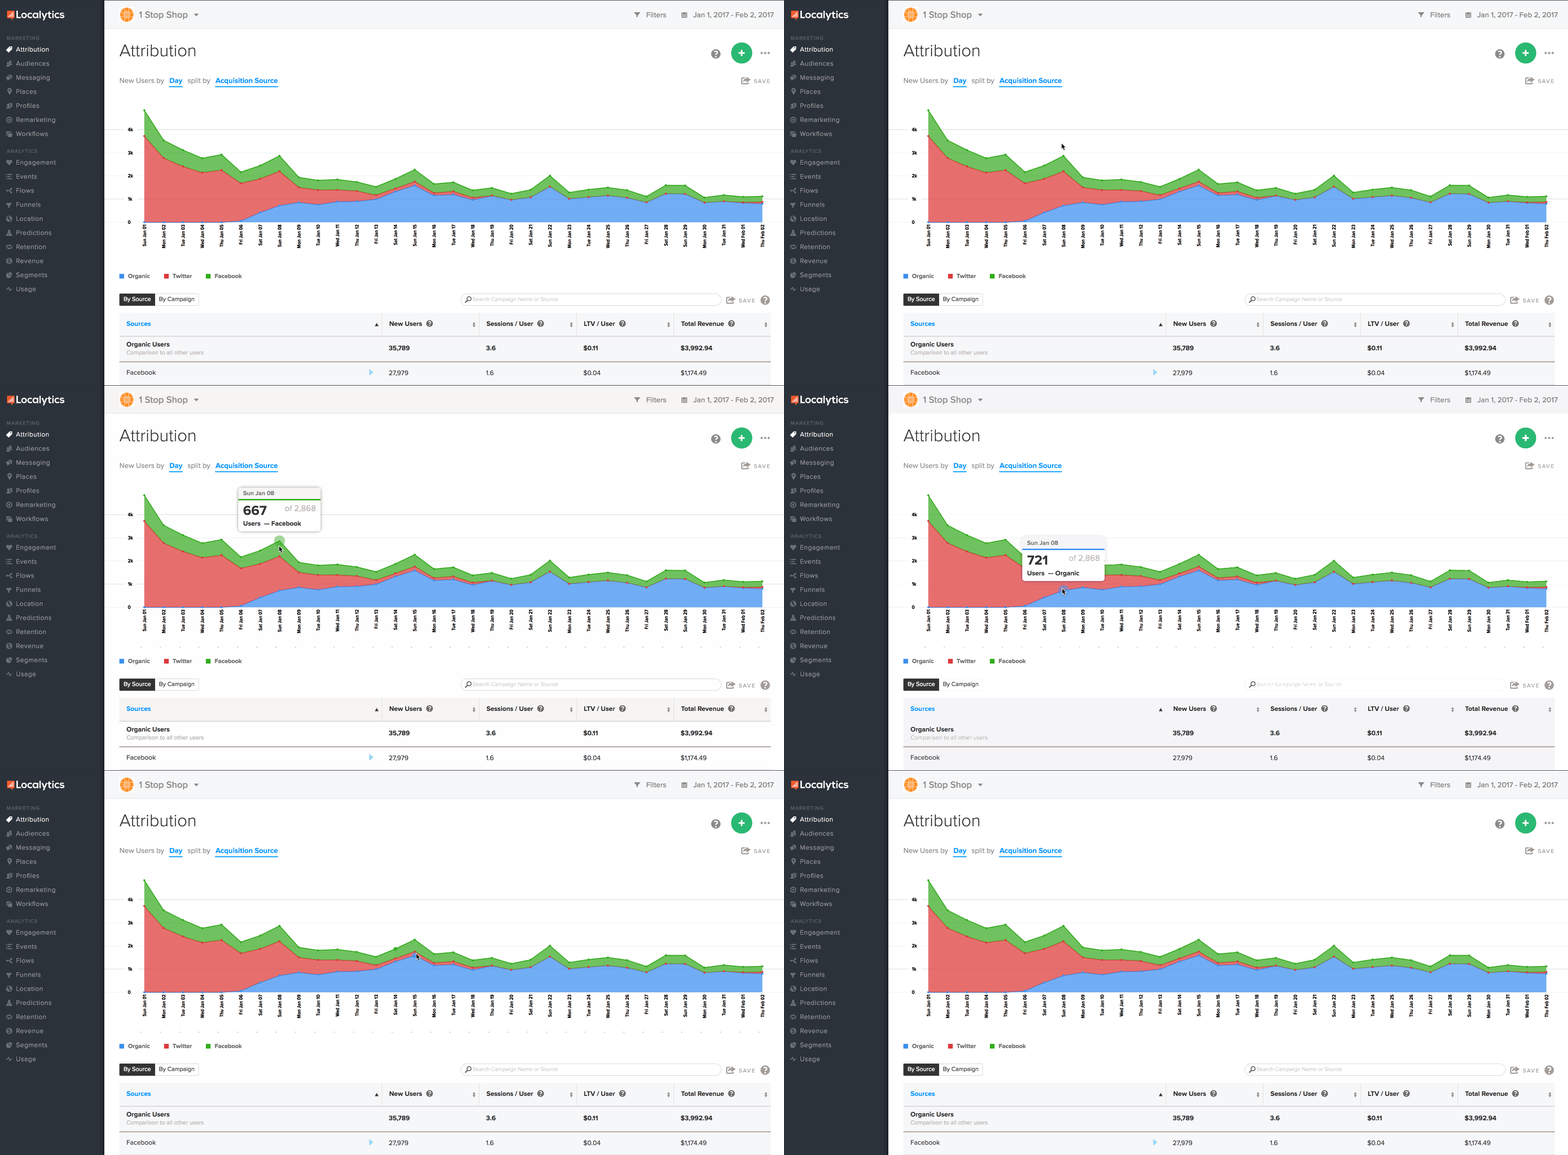
The Attribution report displays the number of users by source.

-
For details, point to any of the points on the chart.
-
To change the date range, select the date range in the upper-right corner. For more information, see Date range.
- In the upper-left corner, select the filter options for the chart:
- Select the New Users by field and select a time frame.
Select the split by field and select a dimension to display.
Assessing the performance of your campaigns
The Attribution table lists of all of your campaigns ordered by source name. This will depend on how your acquisition campaigns are set up in your attribution partner, so consult your third-party partner to better understand this data.
- To sort the display, select By Source or By Campaign in the upper-left corner of the table.
-
To sort the table data, select a heading: New Users, Sessions/Users, LTV/User, or Total Revenue.
Note: For more information about these metrics, point to the question mark next to the title for a quick definition.
- For more information on a source, locate it in the table and select the name to expand its list of campaigns.
-
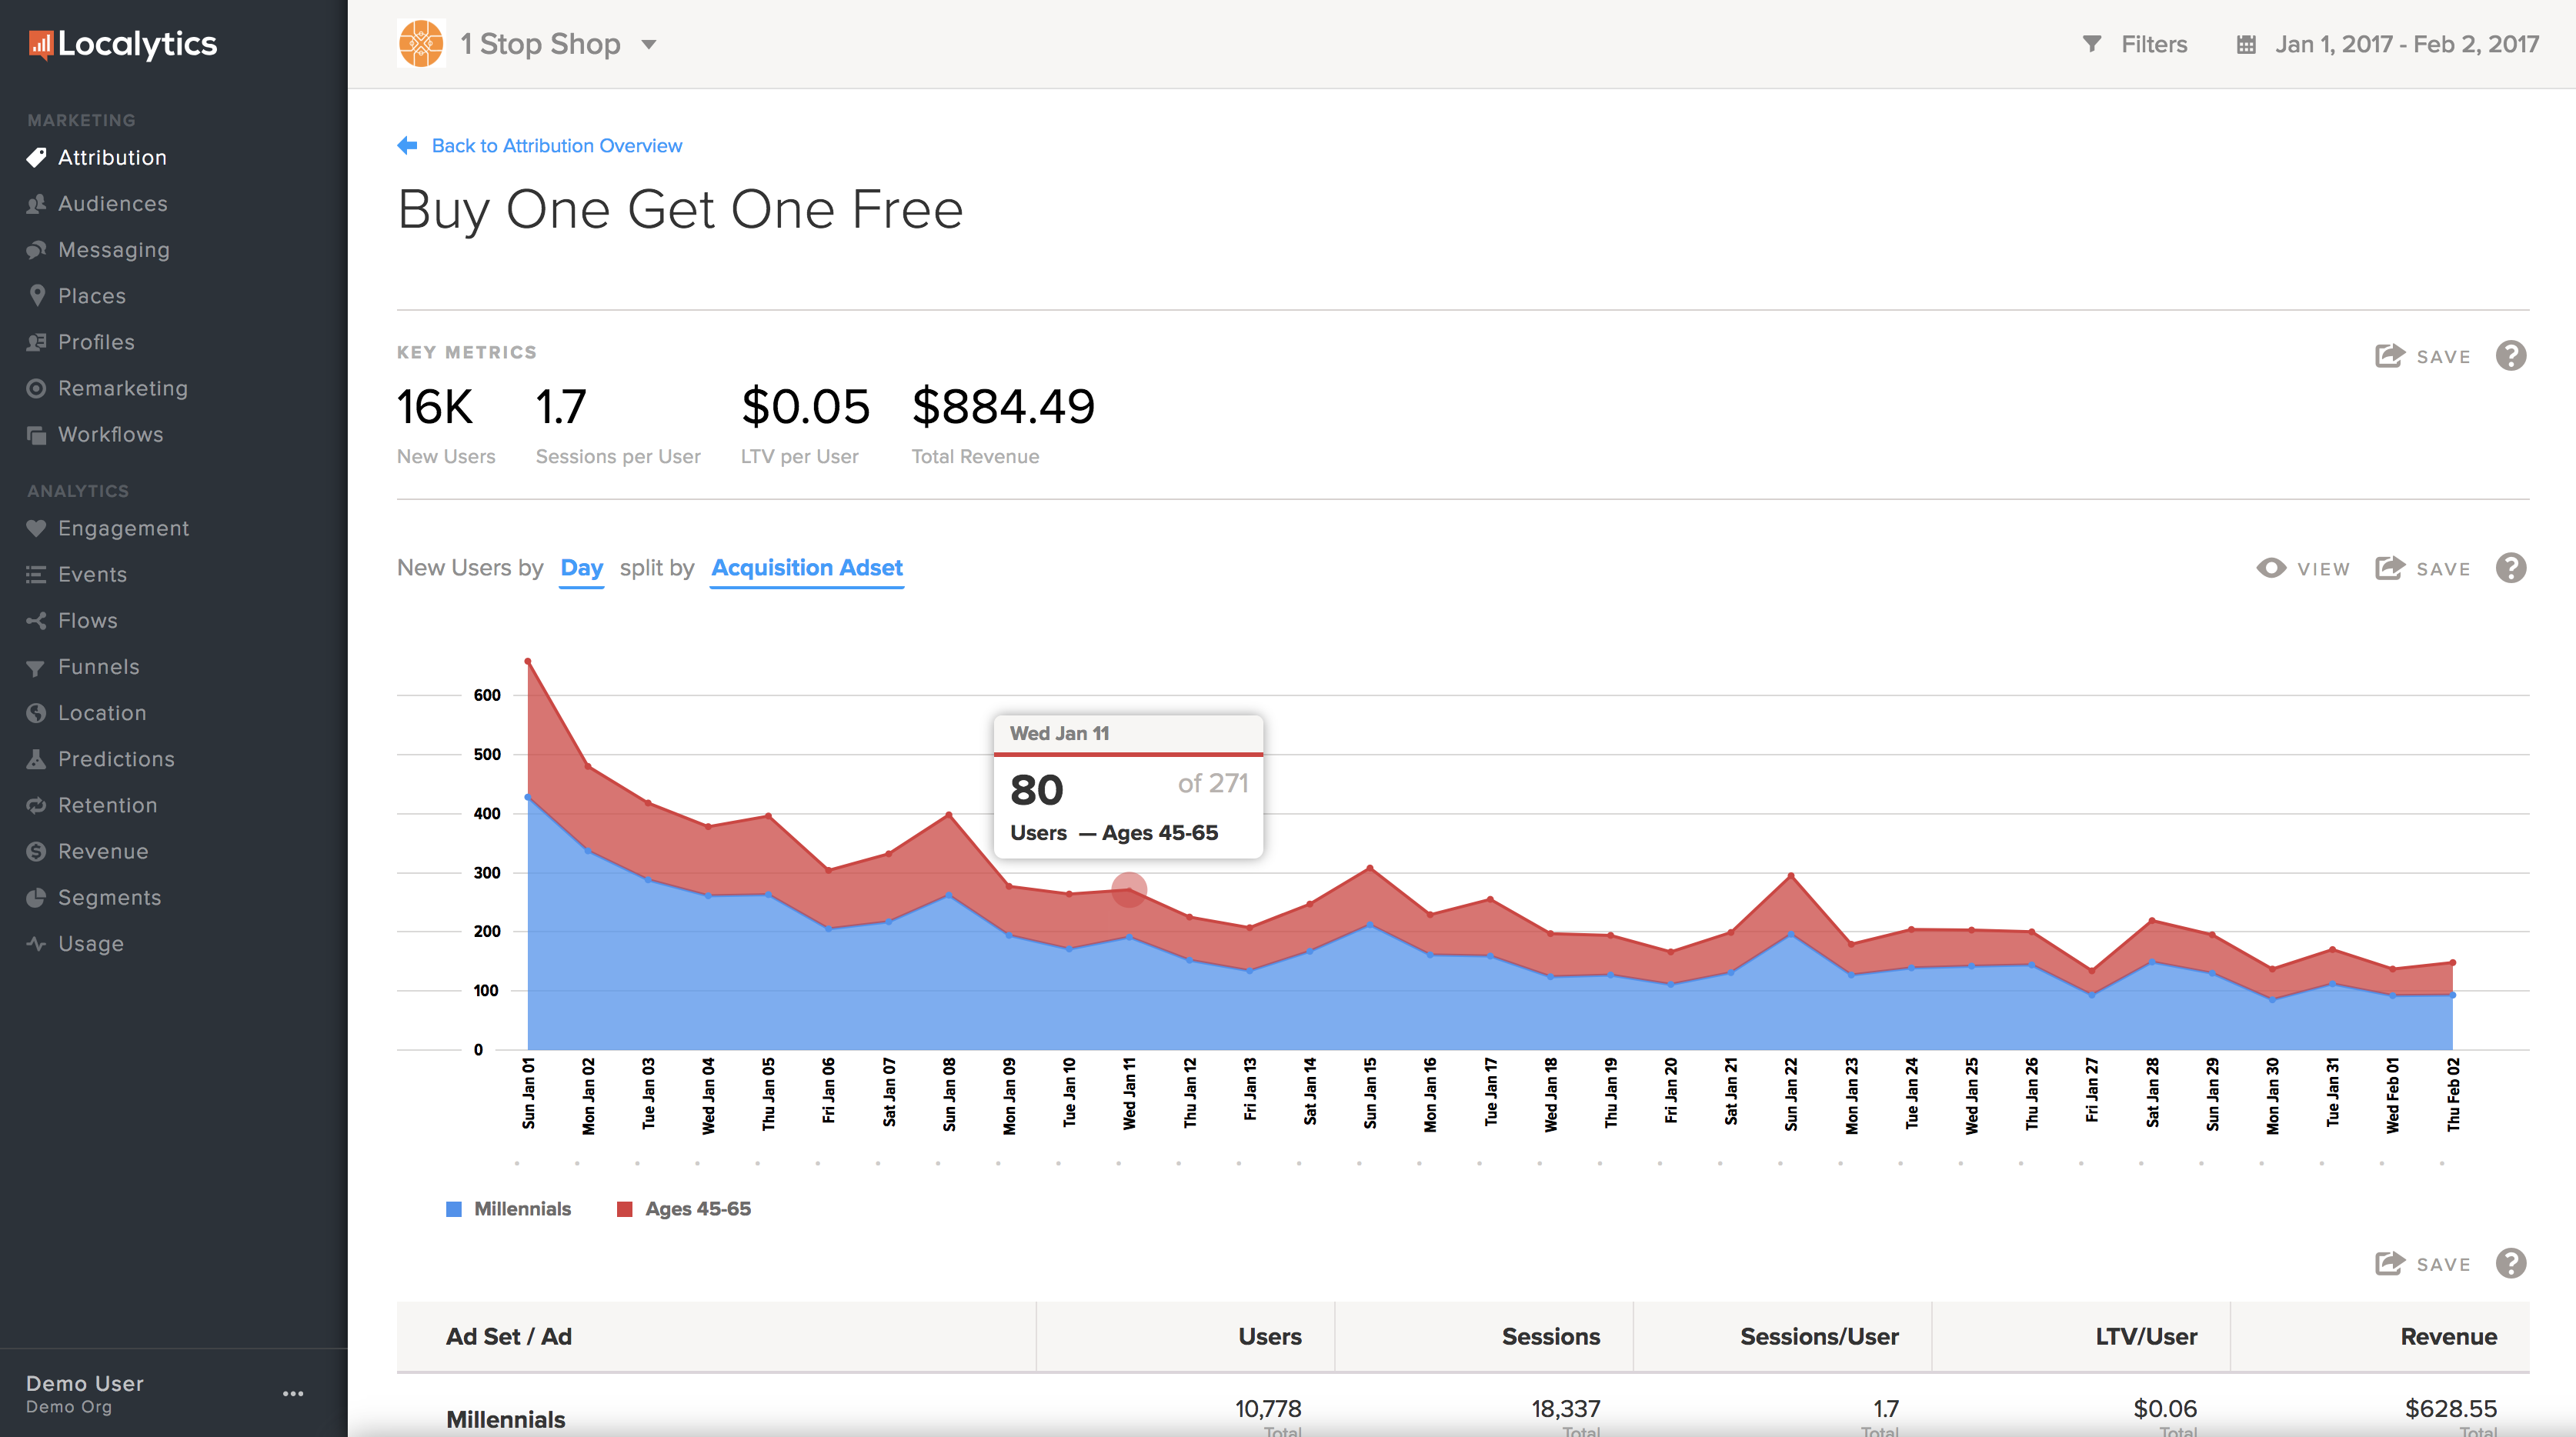
For more information about a campaign, locate it in the table and select the name.

To return to the Attribution dashboard, select Back to Attribution Overview in the upper-left corner of the page.
- Scroll down to the Summary, which reports the total new users from all of your attribution campaigns, as well as the total revenue from those users.